Contact information
Email: info@hendershotresearch.com
Phone: 905.528.6523
Toll-Free: 1.888.893.7634


Database Directions
DatabaseDirections.com provides statistical analysis of current company databases. The amount of information obtained from company databases can be maximized using this service, DatabaseDirections.com. To date, company data may have been obtained from current or potential customers through various methods such as warranty registrations, trade shows, purchases, requests for quotations or website access. However, the actual database obtained may have limited use. An example of a company database is:
| Store Location | Purchase Date | Day of Week | Version | Amount | Age | Postal Code |
| Toronto | October 7 | Wednesday | 1 | $55.00 | 36 | M3W |
| London | December 14 | Friday | 2 | $35.00 | 41 | K8M |
| Hamilton | January 10 | Thursday | 3 | $65.00 | 23 | L8P |
A company provides their current database or spreadsheet (e.g. Excel, MS Access). This database can then be further analysed using SPSS (statistical analysis software) to highlight trends and provide insights towards marketing and advertising strategies. The results can be provided in table or graph formats
Database Directions Table Format
| Store Location | Monday | Tuesday | Wednesday | Thursday | Friday | TOTAL |
| Toronto | 20% | 14% | 18% | 23% | 25% | 100% |
| London | 12% | 12% | 19% | 26% | 31% | 100% |
| Hamilton | 21% | 15% | 18% | 23% | 23% | 100% |
|
* London residents were more likely to shop towards the end of the week. |
||||||
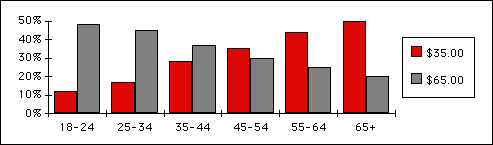
Database Directions Graph Format